16 Nov How to Run Weekly Survey Reports
If you run a continuous survey, you may want to run a weekly or monthly report to get an overview of what was submitted. Follow these steps to set up reporting in your REDCap project.
Step 1: Add a timestamp variable.
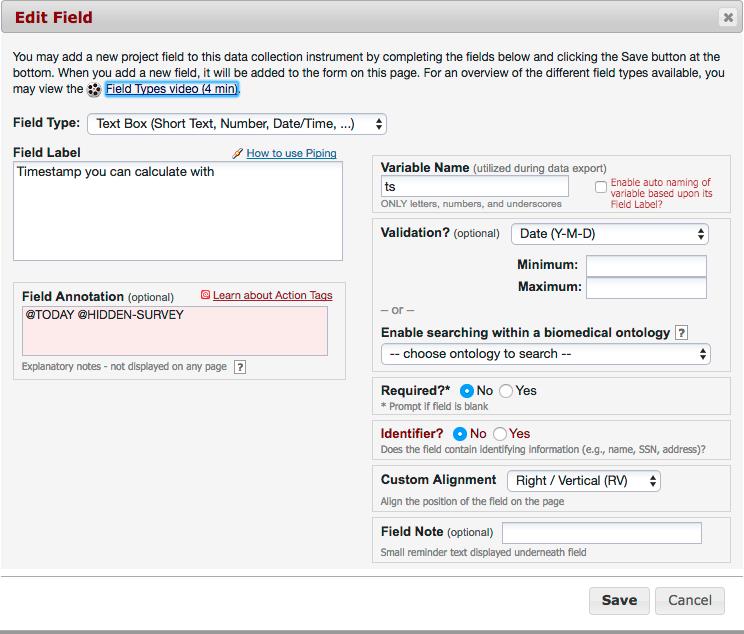
First, add a text variable with the YMD validation and tag that field with the action tags @TODAY and @HIDDEN. If you don’t know how to add action tags, check out our tip on that topic.
This will add a hidden field that will be automatically populated with today’s date. The survey participant will not see this field. We need this field because the normal REDCap survey timestamp is unfortunately not accessible in the reporting tool.
Step 2: Create the report.
Now that we have a variable with a timestamp, we can incorporate it in a report. There are two ways of doing that: dynamically or static.
The Static Method
You will create a report like you normally do in the “Data Exports, Reports, and Stats” menu. Select the appropriate variables, give the report a name, and create a filter with an upper and lower bound date in the Filter section of the report builder. See the example below.
This report will always pull the surveys submitted within the specified date range. If you need to change the date range, you can do that by editing the report.
The Dynamic Method
This method is very similar to the static method, except you will need to write custom logic to make this report dependent on today’s date. First, you’ll need to switch the filter to the custom syntax mode instead of the drag and drop wizard. Click the “Use advanced logic” link next to the “Switch format” tag to do so.
You can then add your custom logic. For example, to pull all the survey results from the last seven days, add the following logic: ((datediff(“today”,[ts],”d”,”ymd”,true))<=0) and ((datediff(“today”,[ts],”d”,”ymd”,true))>=-7)
You will need to customize this code by replacing the “[ts]” with the variable name that you’ve chosen for the time stamp variable in the first step. If you want to select a different dynamic range, change the “0” and the “-7” in the example to the desired range, (e.g. to look at the last month, the values would be “0” and “-30”).


